To compare runs with workspace-level summary metrics, line plots, pinned runs, or a baseline run, see Pin and compare runs. Eval Tables compare aligned examples and Eval Table-specific scores within a logged table.
- Navigate to your project workspace.
- Scroll to the Eval Tables panel.
- Select the + button.
- Select the run that you want to add.
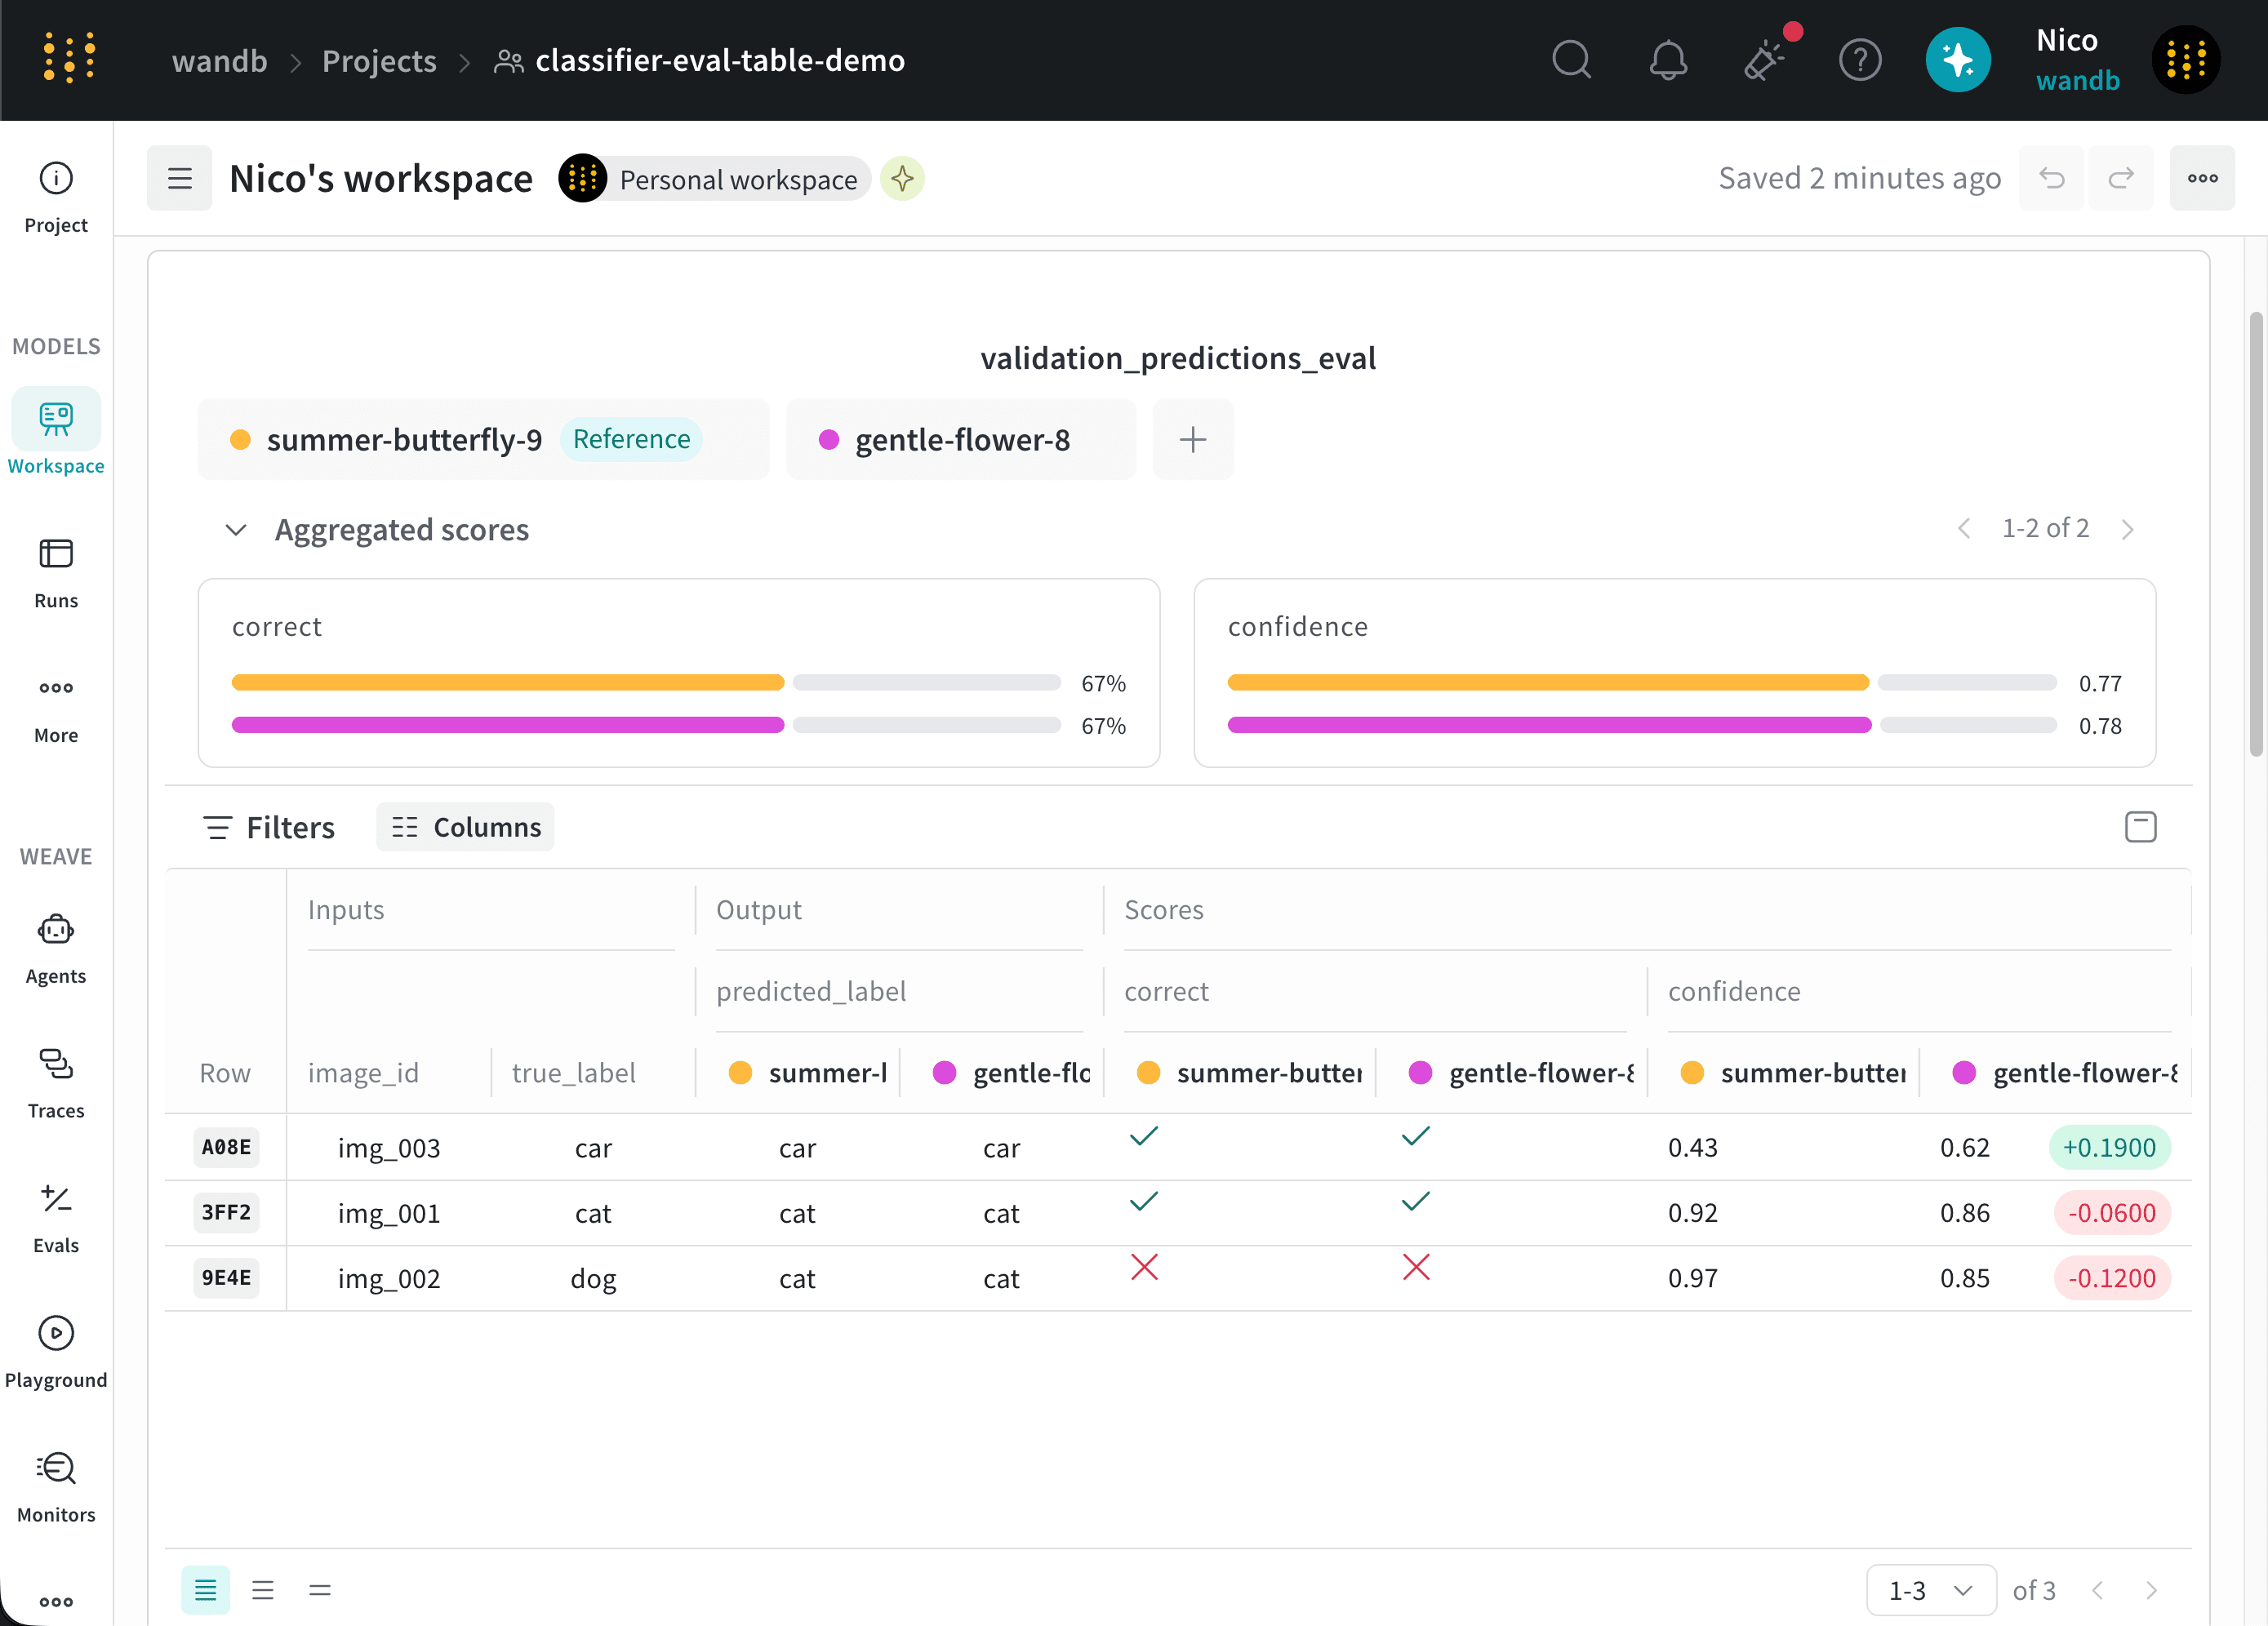
input_columns, W&B displays those columns together in the Inputs section. W&B similarly groups shared output_columns and score_columns in the Outputs and Scores sections.
The following screenshot shows an Eval Table that compares the summer-butterfly-9 and gentle-flower-8 runs:
Set the reference run
When you compare multiple runs, W&B defaults to designating the left-most run as the reference run. The reference run is the baseline to calculate score deltas. To choose a different reference run, hover over the run, open its menu, and select Set as reference.View aggregate scores
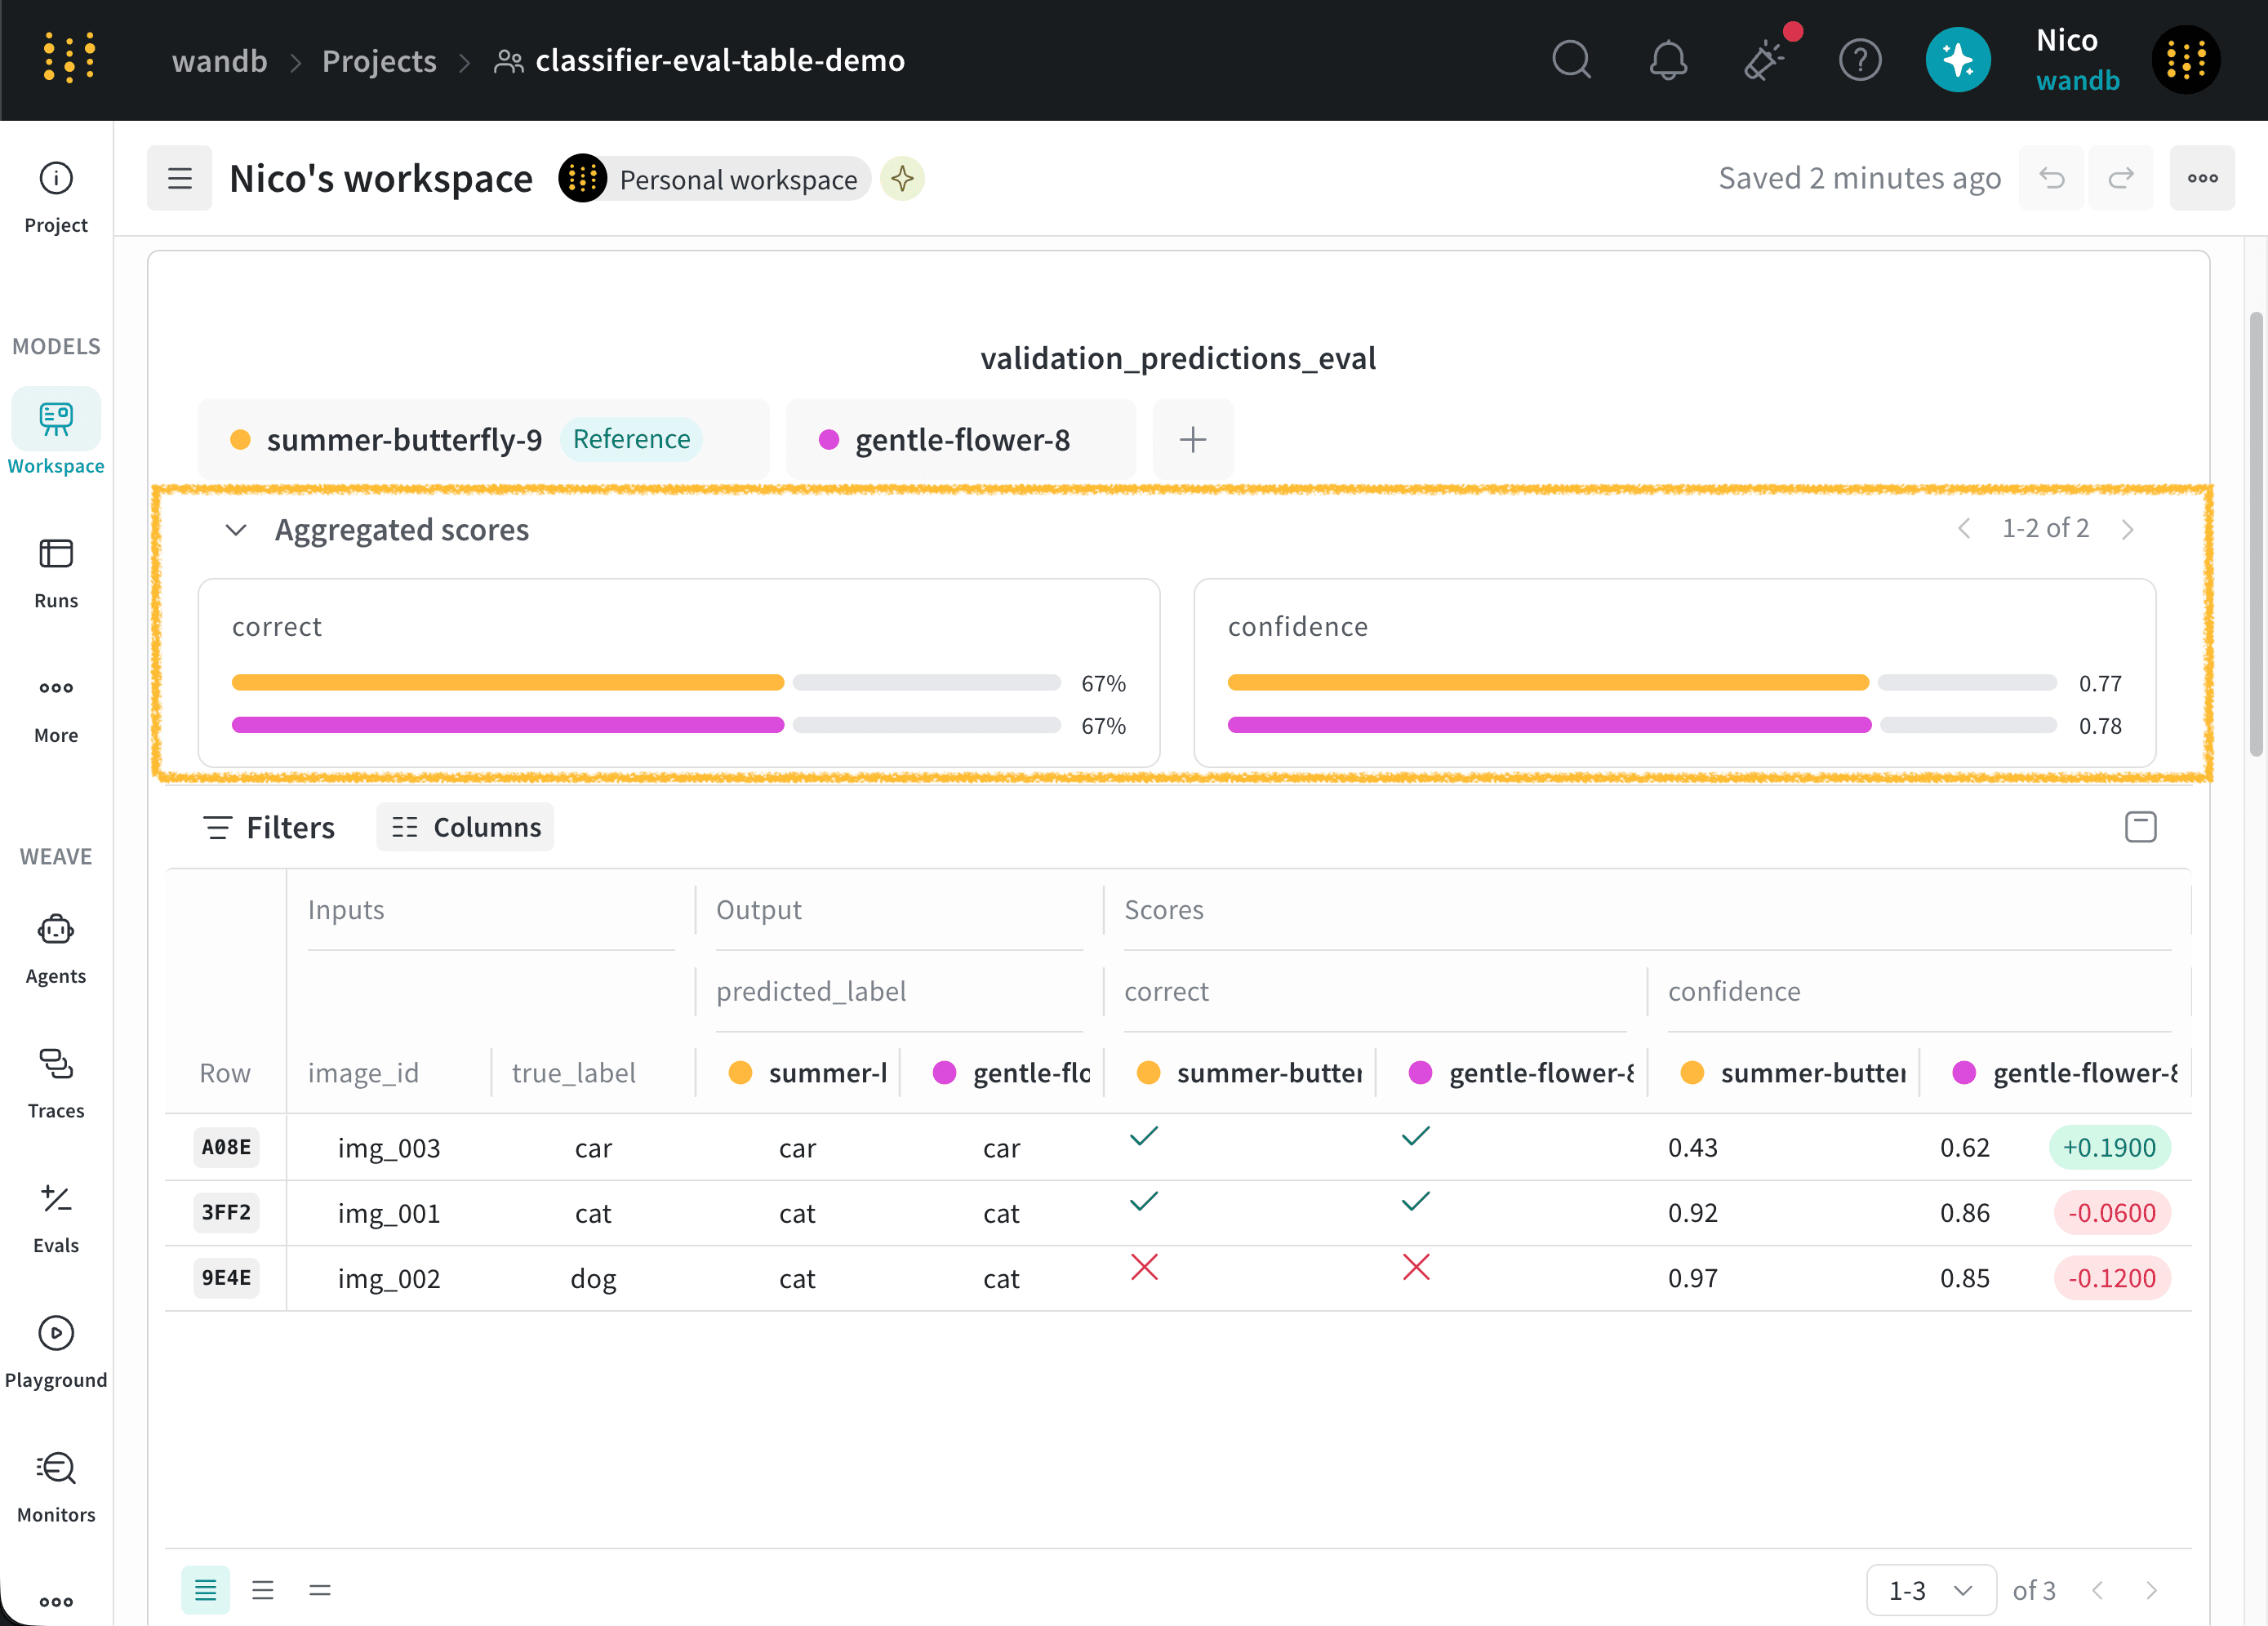
W&B calculates an aggregate value for each score column in each selected run. The calculation depends on the score’s data type:
The following screenshot highlights the aggregate values for the correct and confidence scores:
Compare score deltas
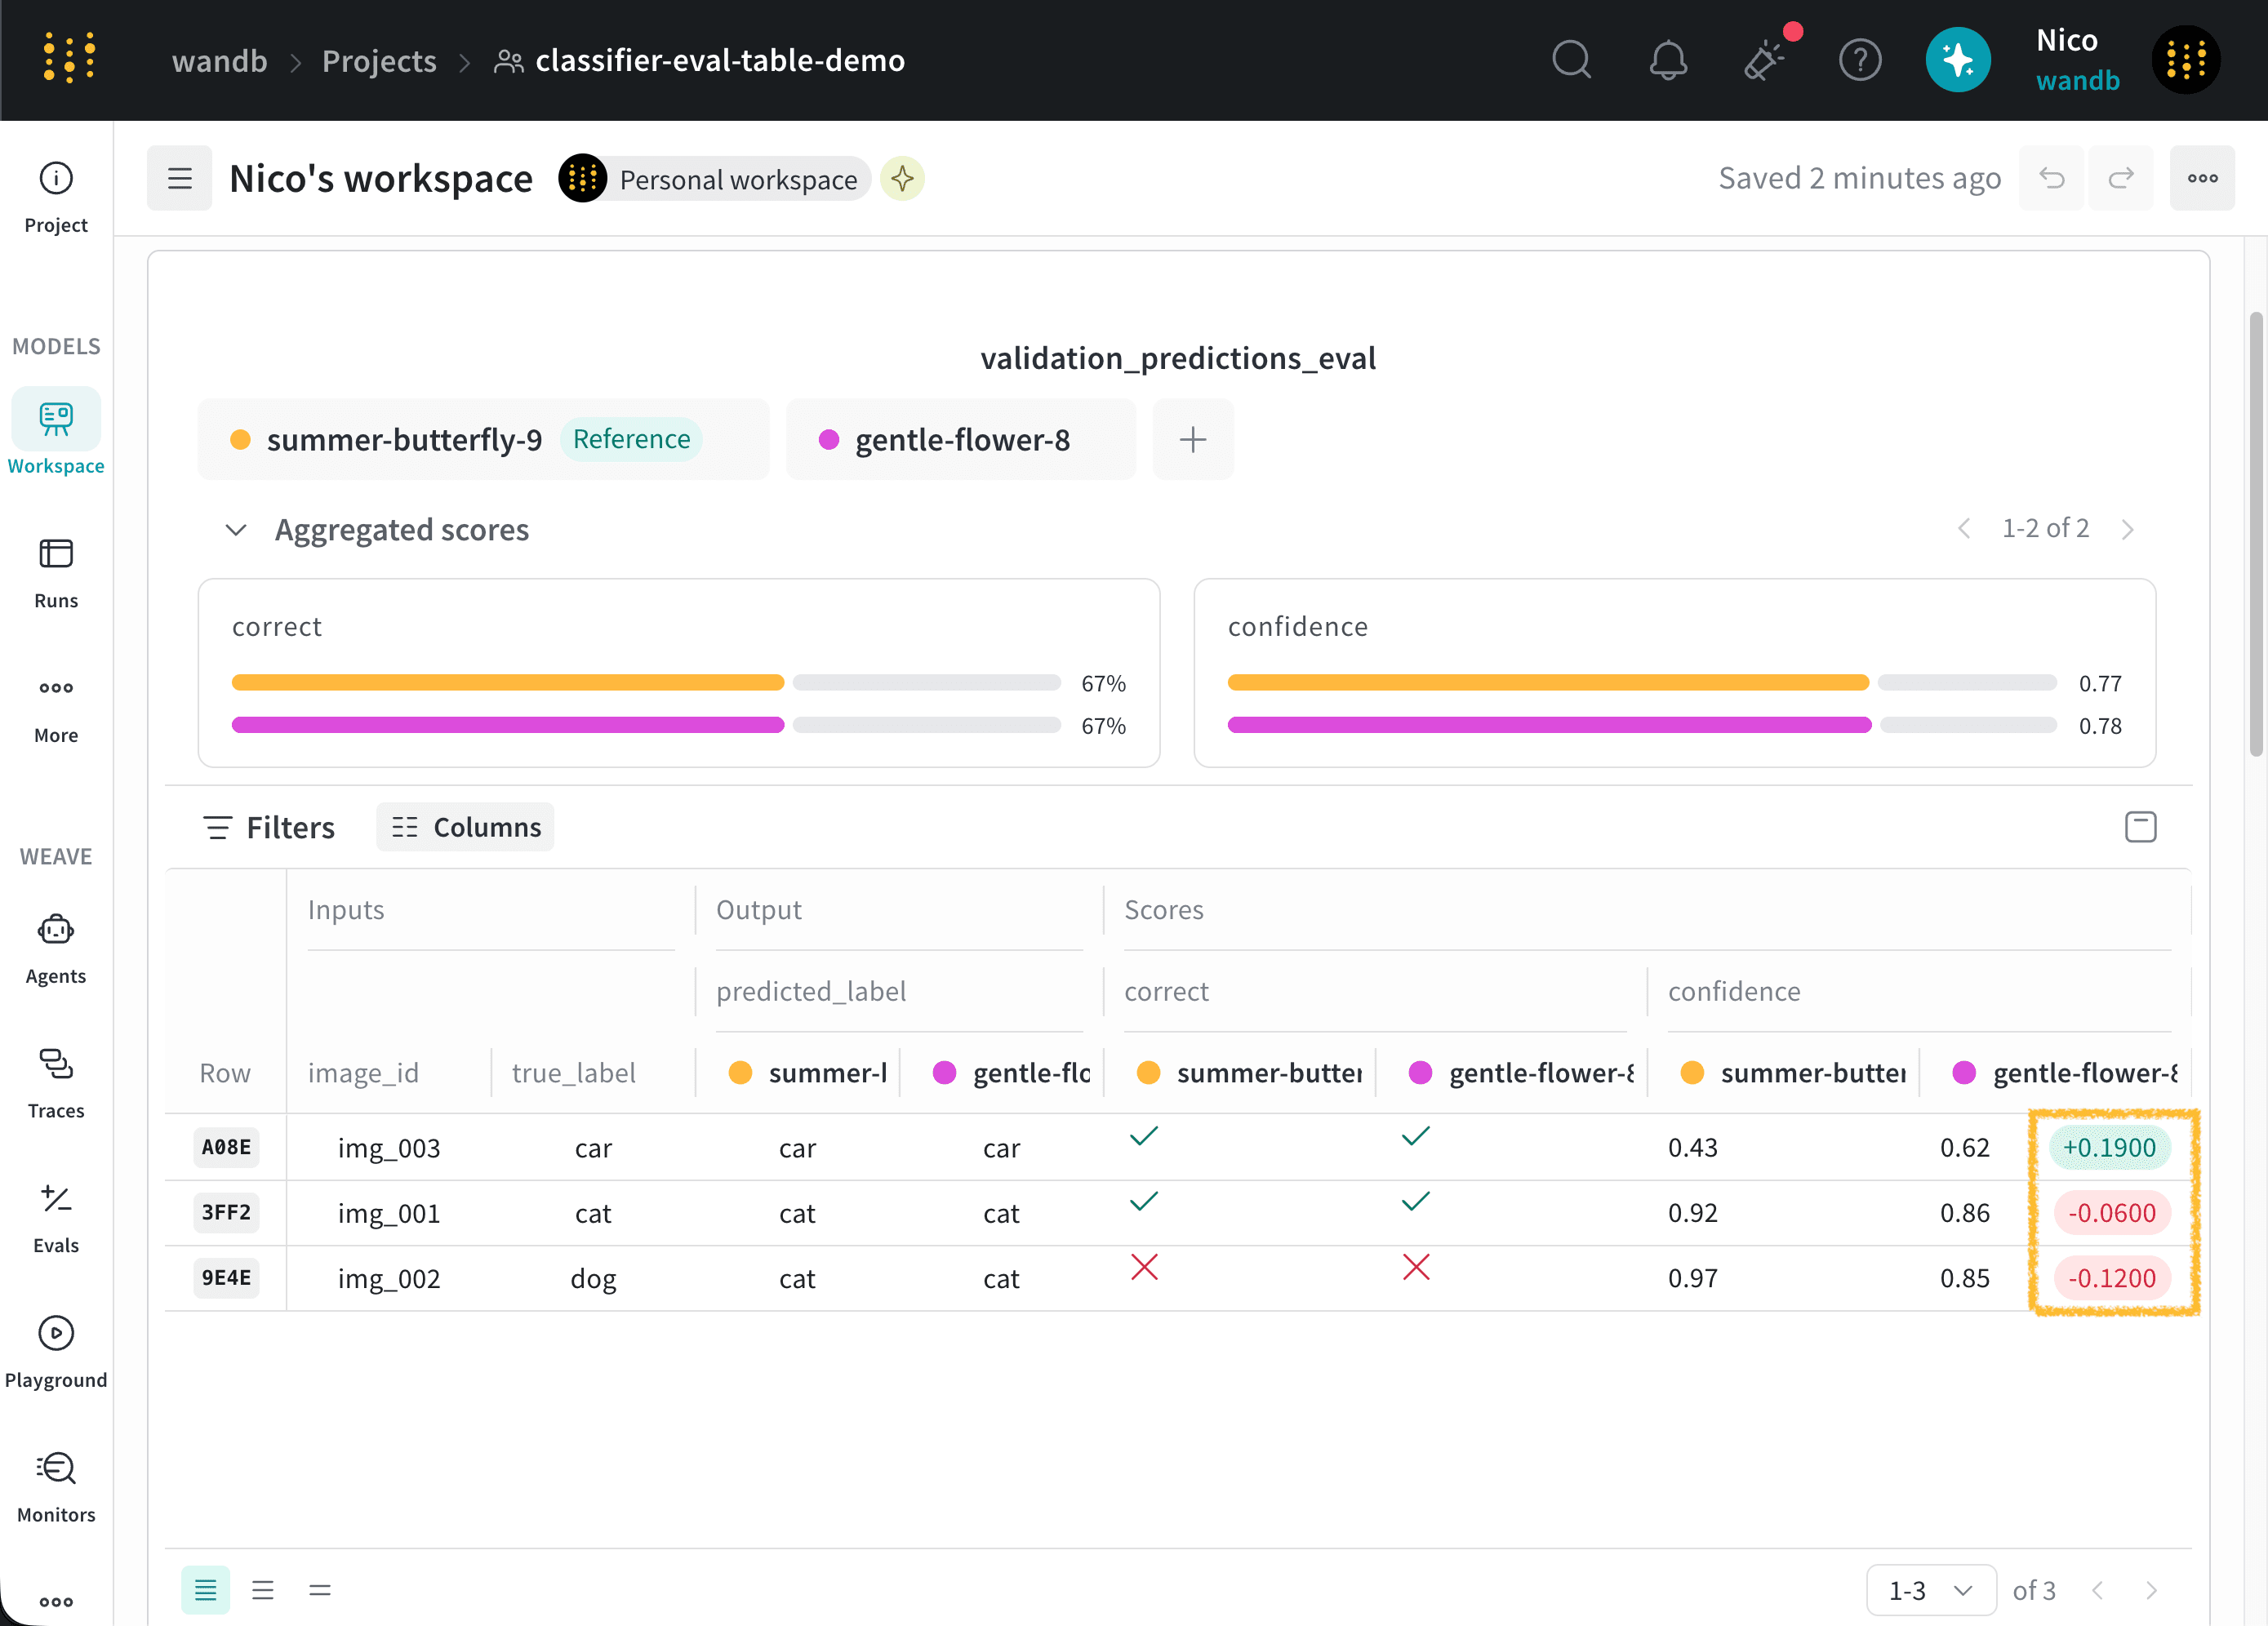
For each score column, W&B calculates the difference between the reference run and every other selected run. W&B calculates each delta as:summer-butterfly-9 is the reference run and gentle-flower-8 is the comparison run. W&B calculates the confidence delta as follows:
A positive delta means that the comparison run has a higher value than the reference run. A negative delta means that it has a lower value.
The following screenshot highlights the score deltas: